The crypto market is bleeding, and Kusama is no exception.

Fundamentally, the coin is propped by positive news. However, Kusama price analysis shows sellers have the upper hand if technical candlestick arrangement guide.
Week-to-date, KSM is down 42 percent but encouragingly stabilizing on the last trading day. Accompanying this rebound is a spike in participation. Although trading volumes shrunk over the weekend, the influx of traders pushed participation to $617 million.
Kusama Market Overview
The KSM price analysis show that it’s changing hands at $303.
At spot levels, the coin is up 10 percent versus the greenback on the last trading day.
Week-to-date, KSM is down 42, 28, and 13 percent against the USD, BTC, and ETH, respectively. Meanwhile, as aforementioned, volumes have more than doubled to $617 million
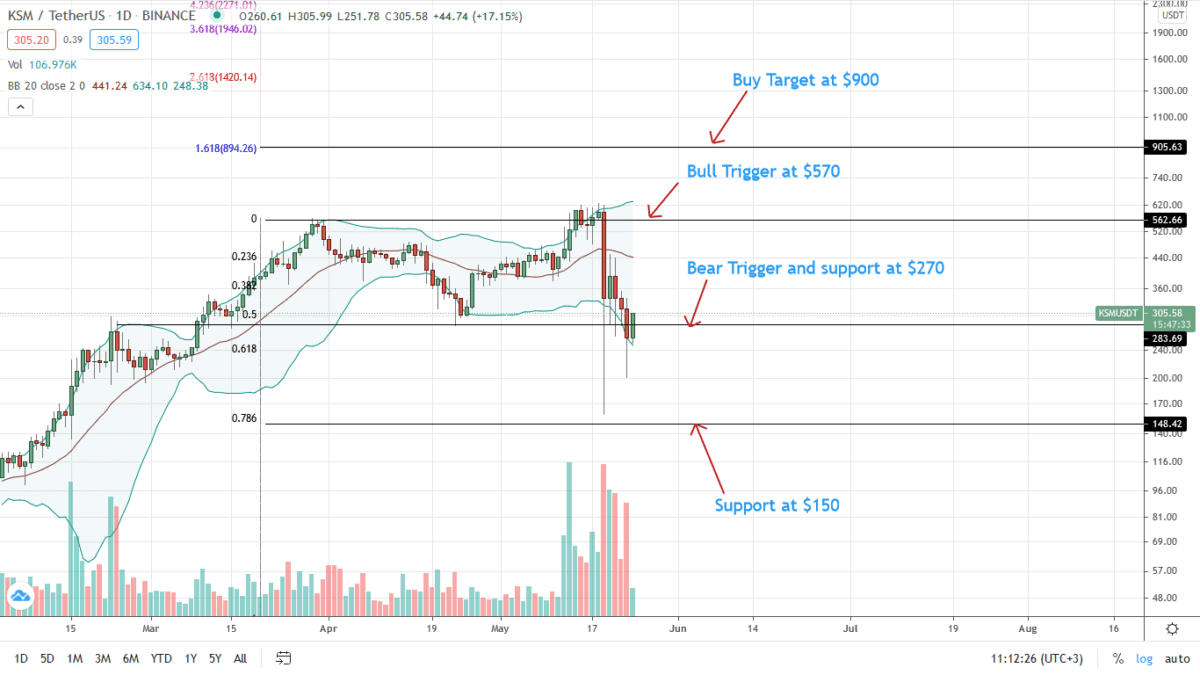
From the daily chart, the KSM/USDT price is trading within a bear breakout pattern following May 23 losses.
Technically, KSM/USDT’s consolidation of the last few trading weeks is proving to be distribution. At this pace, therefore, the path of least resistance could be southwards in the medium term.
A possible reaction point in the immediate term stands at $150—the 78.6 percent Fibonacci retracement level of the Q1 2021 trade range.
Kusama Market Movers
Kusama is an independent blockchain, considered Polkadot’s cousin. It is because, from the network, tests can be done before activation in Polkadot.
Bearing similar properties as Polkadot, Kusama is equally scalable and interoperable. Kusama is a canary network, offering a low barrier to entry for deploying parachains. Accordingly, developers are free to launch dApps, gaining access to features that aren’t deployed in Polkadot.
KSM holders approved the proposal to activate Kusama parachains on May 17.
Next, developers are back to work:
From this, Kusama network users are now preparing for the first Parachain auctions.
Once crowd loans are live, it will become easy for projects to raise KSM from the community in return for the native token. Unlike ICOs, KSM coins collected are not sent to the team.
Instead, they are locked until the lease period (anywhere between six to 24 months) ends. After that, the principal is returned.
Kusama Price Analysis

KSM bears are in control.
From the daily chart, prices are trending below April 2021 lows, trending inside May 19 bear bar stick.
Technically, every pullback is a loading opportunity for aggressive traders. Notably, following the losses of May 19, KSM/USDT is trading within a bear breakout pattern. Additionally, bars are now aligning with the lower BB suggesting high sell pressure.
Determined from the KSM/USDT arrangement, the first bear target is $150. This level flashes with the 78.6 percent Fibonacci retracement level of the Q1 2021 trade range.
A sharp double-bar bull reversal pattern unwinding May 23 bears, driving KSM/USDT prices towards $450, and the middle BB may reinvigorate demand in a buy trend continuation formation.
Disclaimer: Opinions expressed are not investment advice. Do your research.


