With hundreds of cryptocurrencies exchanges appearing almost out of nowhere trying to secure a slice of the pie, some of them are not quite the crypto heavens they advertise themselves to be. Unfortunately, scammers are increasingly targeting cypto traders with fake landing pages designed to mimic the real deal and fraudulent websites that promise a safe trading platform when in fact their intentions are quite the opposite.
Backed by Japanese financial giant SBI Holdings, CoVenture has identified two strategies anyone can use to check if their favorite cryptocurrency platform engages in ill practices such as wash trading or inflating trading volumes. Whether you are worried about your exchange’s legitimacy, it worthwhile to keep the two following aspects into account.
1. A predictable pattern in trading volume
According to the report, a fraudulent exchange typically follows a predictable pattern to make their trading volume appear bigger than it is:
- Place an order on the market where the bid-ask spread is high
- Execute buy and sell orders at a price existing order book does not have
- Repeat this process until unsuspecting traders place an order closing the bid-ask spread
- Windraw order
2. A series of indicators that lead to wash trading
CoVenture also identified five common used indicators that lead to wash trading:
- An extremely high percentage of API driven trades on the exchange
- A high amount of transactions occurring during hours traders in specific time zones are offline
- Transactions larger than the order book size
- Repeated transactions at same order at an identical price
- No price volatility despite high liquidity
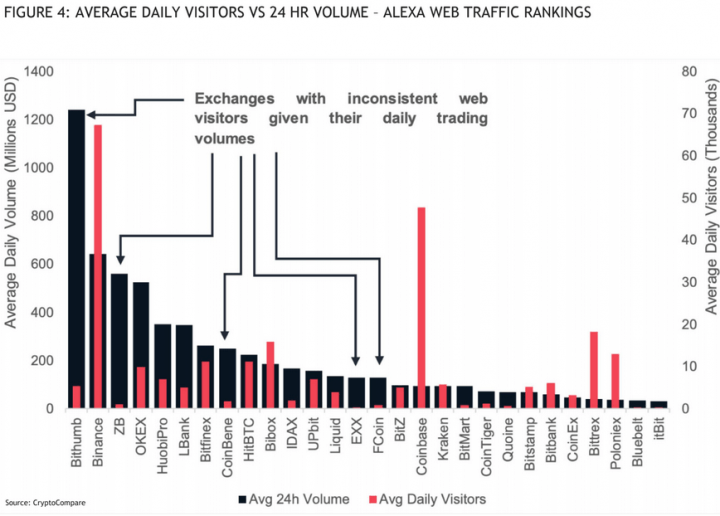
Further, the report explains how these two strategies can be used by anyone to spot suspicious trading volumes on any crypto exchange. The first strategy can be used to compare the daily volume traded with the average number of visitors that landed on the website on a daily basis.
For example, the figure below displays this comparison:

For example, by using this strategy it is easy to observe that Bithumb has a low average of daily visitors compared to the average 24 hour volume traded.
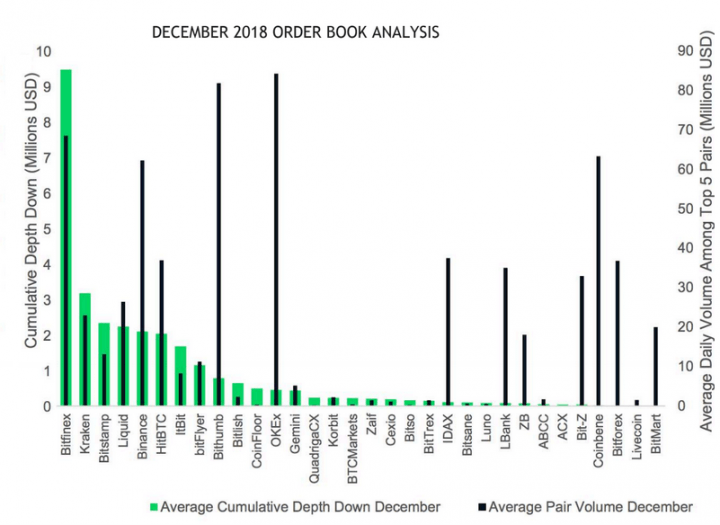
The second strategy can be used to analyze the depth order book on any exchange. In order to display this, CoVenture have used data from CryptoCompare in order to calculate how much capital would be necessary to crash a price in a top 5 market by 10%.

By studying this figure, we can observe that crypto exchange CoinBene is having a particularly high inorganic trading volume while jumping from a relatively unknown crypto platform that initiated in November 2017 to the top 25 exchanges by report volume, in less than 18 months.
CoinBene’s numbers are also displaying a similar 24-hour trading volume as Bitfinex while it only takes $13,600 to crash the cryptocurrency price of the top 5 markets by 10%. To engage in the same practice, Bitfinex on the other hand would require $9.47 million in trading capital.
Resource:
CoVenture Cryptocurrency Liquid – Exchange Liquid Whitepaper (February 2019)


