The Bitcoin Rally and Growing Market Cap
What an eventful year it has been for Bitcoin. In a record-breaking 4 quarters, BTC is trading at record highs spurred mainly by the speculative pressure which in turn is pushing market capitalization up. It appears that no one wants to miss out on this mega train bull rally.
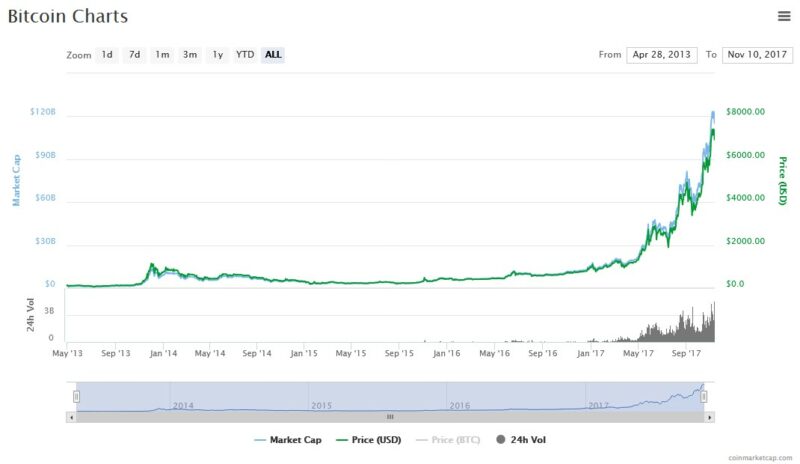
As of this writing market cap stands at $113B representing 57.1% of the cryptocurrency market sphere. Other than speculation, investors believe that the limited nature of this digital, tamper proof asset is bound to rise as value is derived from its underlying technology.
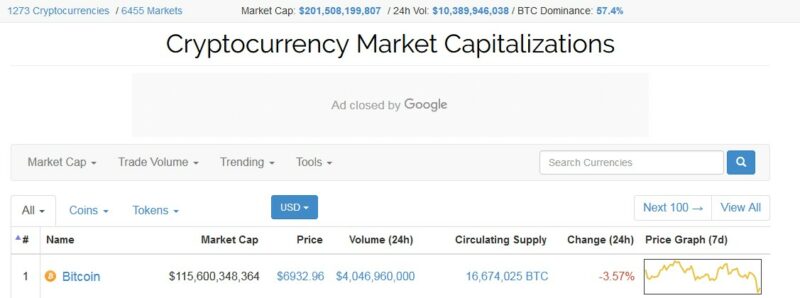
The final BTC count to ever circulate is pegged at 21M. BTC trackers indicate that 79% of these coins are already in the network. Three more years remain before halving of miner’s BTC compensation and it is projected that BTC deflationary forces will set in afterwards.
Don’t press the panic button yet, this mega event is scheduled for June 12, 2020 and the generous 12BTC reward per block verification will be slashed to 6.5BTC. By then that might be $325K per block which is still awesome business.
Bitcoin Fundamental Analysis
What was Segwit 2X and why it was put Off
Ignoring previous restrictive events which BTC overcame; Segwit 2X hard fork would have defined BTC future if not for the constant community disagreements. Before November 8, it looked likely that by November 14 Segwit 2X would be online given consensus at that time. With a 95% hash rate backing and leading exchanges, developers and wallets providers publically calling for capacity improvement, BTC could have had a significant portion of its value wiped.
Knowing this, BTC owners played safe by simultaneously waiting for another free “dividend” from their wallets and shifting their capital to other alt coins which as expected rallied. USDT (Tether) a safe haven crypto currency anchored at $1 against the USD also rose in anticipation of the hard fork. Concurrently, top tier, high market cap alt coins were pumped with each appreciating by double digits over the past two days.
It is now emerging that Segwit 2X proponents, Ticker symbol B2X or S2X didn’t get the much needed community backing. Issue of Replay attacks remained a contentious subject even after S2X developer team assured BTC owners that an opt-in replay protection scheme was available. All in all, this last minute abortion of a fundamental event that had been drummed up for weeks because of lack of consensus deflated BTC.
Before the announcement, $8000 psychological prices were strongly rejected after BTC rose to as high as $7800 on November 8.
Compared to previous events that affected BTC directly like Chinese crackdown on BTC mining and consequent ban of ICOs, rejection of BatsBZX Bitcoin ETF by SEC, BCH hard fork, UASF after NYA agreement and its implementation on August and finally BTG hard fork on October 25, volatility could have been high given the support Jack’s proposal had received.
Nevertheless, all of these BTC related events subscribe to the same script judging from historical price action: They are perfect at rendering technical indicators useless. It’s all driven by sentiment and that at the moment, quantifying sentiment has its own challenges.
Bitcoin Technical Analysis
To visualize this, let’s use two indicators. Stochastics to measure overbought and oversold conditions and Bollinger Bands as a volatility measuring tool. Pasting these two on the BTC price chart reveals price behaviors that are frequent in FX and other legacy markets especially during scheduled announcements like monetary policy statements. Those of unpredictability, whip sawing and invalidation of set ups hinted by technical indicators.
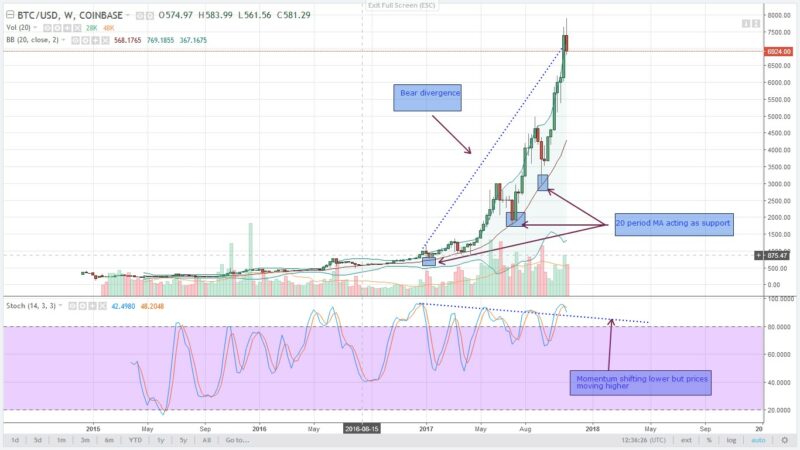
Weekly and Monthly chart bear divergence
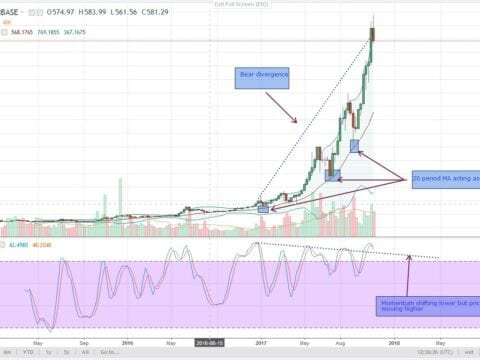
In the weekly and monthly chart for example, BTC price action has been trending in overbought territory for the better part of this year. From Q1 highs of $1360, bear momentum increased but BTC prices edged higher in Q2 at $3000 and Q3 at $4453. Also note that every time there was a correction, the middle BB or the 20 period MA shored prices resulting in a clear and classic bear divergence.
Daily Chart sharp wedge
Such unique scenarios necessitate use of trend lines which are largely effective. Our support and resistance trend lines converge to form a wedge as shown in the daily chart. Note that on October 31, BTC prices surged past the resistance trend line. At the same time, prices were making higher highs but momentum was drifting lower resulting in another bear divergence. As I said earlier, this is inconsequential because emotion was driving prices higher.
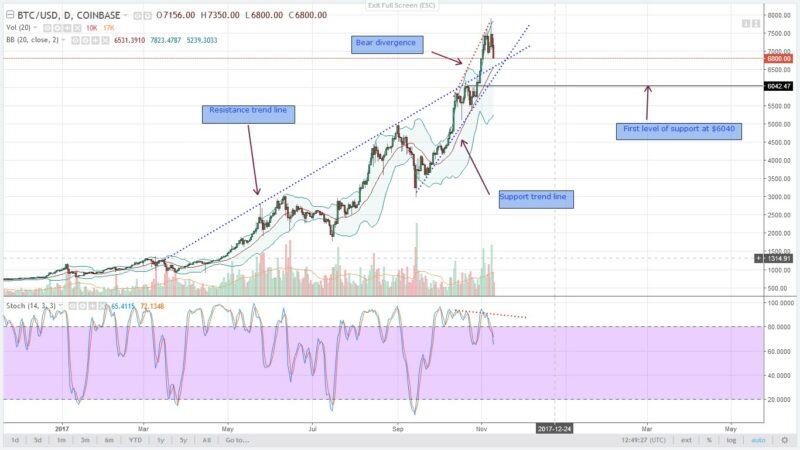
Correction from $7800
Zoom in closer and you notice that on November 5, BTC closed above the upper BB at $7392 meaning that the coin was overpriced. Afterwards, prices drifted lower in the process making lower lows against the upper BB.
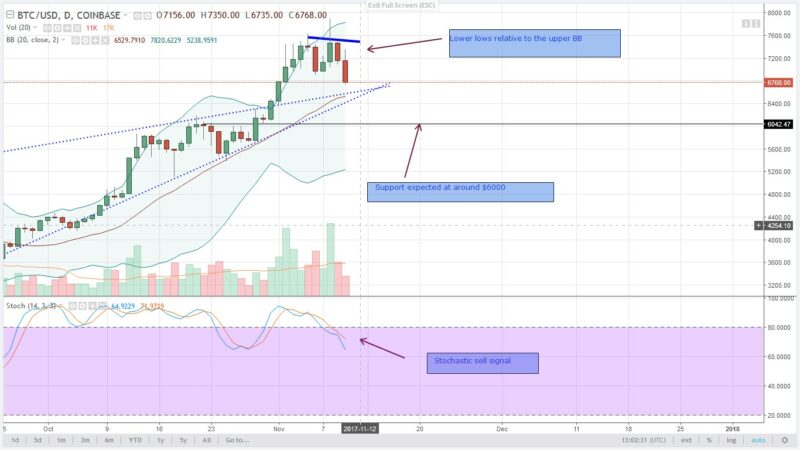
After testing highs of $8000 on Wednesday, BTC nosedived and at current prices below $6800, $1000 has been shed. Bear momentum is expected to continue since there is a stochastic sell signal. Immediate support lies at around $6000Pre-BTG hard fork BTC level.
